26.3. Sample Code-Runner Section#
26.3.1. 显示执行内容#
此处使用 Python 构建 .ipynb 代码块,显示内容为 Cache 缓存。
在 _config.yml 中可以添加 allow_errors 标签,允许在单元级别出现错误。
print("A Python Cell")
for i in range(50):
    print(i)
A Python Cell
0
1
2
3
4
5
6
7
8
9
10
11
12
13
14
15
16
17
18
19
20
21
22
23
24
25
26
27
28
29
30
31
32
33
34
35
36
37
38
39
40
41
42
43
44
45
46
47
48
49
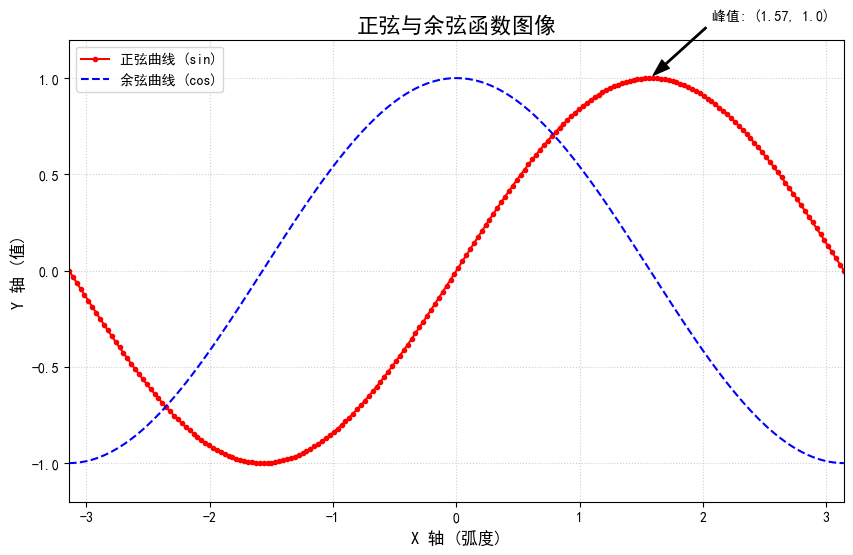
26.3.2. 使用 Matplotlib 库绘制图表#
使用 mystnb 中 image 的 width 来调整图片的大小。
import matplotlib.pyplot as plt
import io
import numpy as np
from IPython.display import Image # 明确引入 Image

plt.rcParams['font.sans-serif'] = ['SimHei']
plt.rcParams['axes.unicode_minus'] = False

x = np.linspace(-np.pi, np.pi, 200)
y_sin = np.sin(x)
y_cos = np.cos(x)

fig, ax = plt.subplots(figsize=(10, 6), dpi=100)
ax.plot(x, y_sin, color='red', linestyle='-', marker='o', markersize=3, label='正弦曲线 (sin)')
ax.plot(x, y_cos, color='blue', linestyle='--', label='余弦曲线 (cos)')
ax.set_title('正弦与余弦函数图像', fontsize=16)
ax.set_xlabel('X 轴 (弧度)', fontsize=12)
ax.set_ylabel('Y 轴 (值)', fontsize=12)
ax.set_xlim(-np.pi, np.pi)
ax.set_ylim(-1.2, 1.2)
ax.grid(True, linestyle=':', alpha=0.6)
ax.legend(loc='upper left')

peak_x = np.pi / 2
peak_y = np.sin(peak_x)
ax.annotate(
    f'峰值: ({peak_x:.2f}, {peak_y})',  # 注解文本
    xy=(peak_x, peak_y),              # 要标注的点
    xytext=(peak_x + 0.5, peak_y + 0.3), # 文本放置的位置
    arrowprops=dict(facecolor='black', shrink=0.05, width=1, headwidth=8), # 箭头样式
    fontsize=10
)
26.4. 使用 Glue 功能#
26.4.1. 使用 Glue 进行绘图#
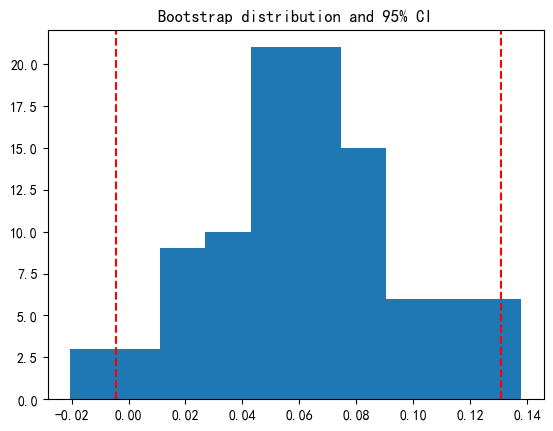
这是一个在 Jupyter Book 中使用 myst_nb 的 glue 功能来嵌入 Matplotlib 图表的标准示例。整个过程分为两步:
在代码单元格中,创建图表并使用
glue()函数将其“粘”起来。在下方的 Markdown 文本中,使用
{glue:}角色将图表插入到您想要的位置。
# 1. Import necessary libraries
import numpy as np
import matplotlib.pyplot as plt
from myst_nb import glue

# 2. Create sample data (This is the missing part)
# We need to define 'means', 'clo', and 'chi' before we can plot them.
np.random.seed(0) # for reproducible results
data = np.random.randn(100)
bootstrap_indices = np.random.randint(0, 100, size=(1000, 100))

# Calculate the variables your plotting code needs
means = data[bootstrap_indices].mean(0)
clo, chi = np.percentile(means, [2.5, 97.5])


# 3. Your original plotting code (Now it will work!)
# Visualize the histogram with the intervals
fig, ax = plt.subplots()
ax.hist(means)
for ln in [clo, chi]:
    ax.axvline(ln, ls='--', c='r')
ax.set_title("Bootstrap distribution and 95% CI")

# And a wider figure to show a timeseries
fig2, ax = plt.subplots(figsize=(6, 2))
ax.plot(np.sort(means), lw=3, c='r')
ax.set_axis_off()

# Glue the figures to be used later in your Jupyter Book
glue("boot_fig", fig, display=False)
glue("sorted_means_fig", fig2, display=False)

print("Code executed successfully! The variables 'means', 'clo', and 'chi' are now defined, and the figures have been glued.")
Code executed successfully! The variables 'means', 'clo', and 'chi' are now defined, and the figures have been glued.
26.4.2. 使用 Glue 功能显示文本#
from myst_nb import glue
my_variable = "here is some text!"
glue("cool_text", my_variable)
'here is some text!'
第一种形式的展示:’here is some text!’
第二种形式的展示:
'here is some text!'
26.5. 使用 Binder 组件建立 Run 按钮#
a = 1
b = 2
print(a + b)
import numpy as np
print("Numpy 版本:", np.__version__)
26.5.1. 使用滑块控制变量的值#
import ipywidgets as widgets
from IPython.display import display

# 创建一个名为 slider_a 的整数滑块
slider_a = widgets.IntSlider(
    value=10,
    min=0,
    max=20,
    step=1,
    description='变量 A:',
    continuous_update=False  # 仅在释放鼠标时更新,体验更好
)

display(slider_a)
print("滑块已创建。请拖动它,然后运行下方的代码块。")
# 这个代码块会读取上面那个滑块的当前值
variable_b = 100
current_a = slider_a.value

result = current_a + variable_b

print(f"滑块 '变量 A' 的当前值是: {current_a}")
print(f"计算结果: {current_a} + {variable_b} = {result}")